
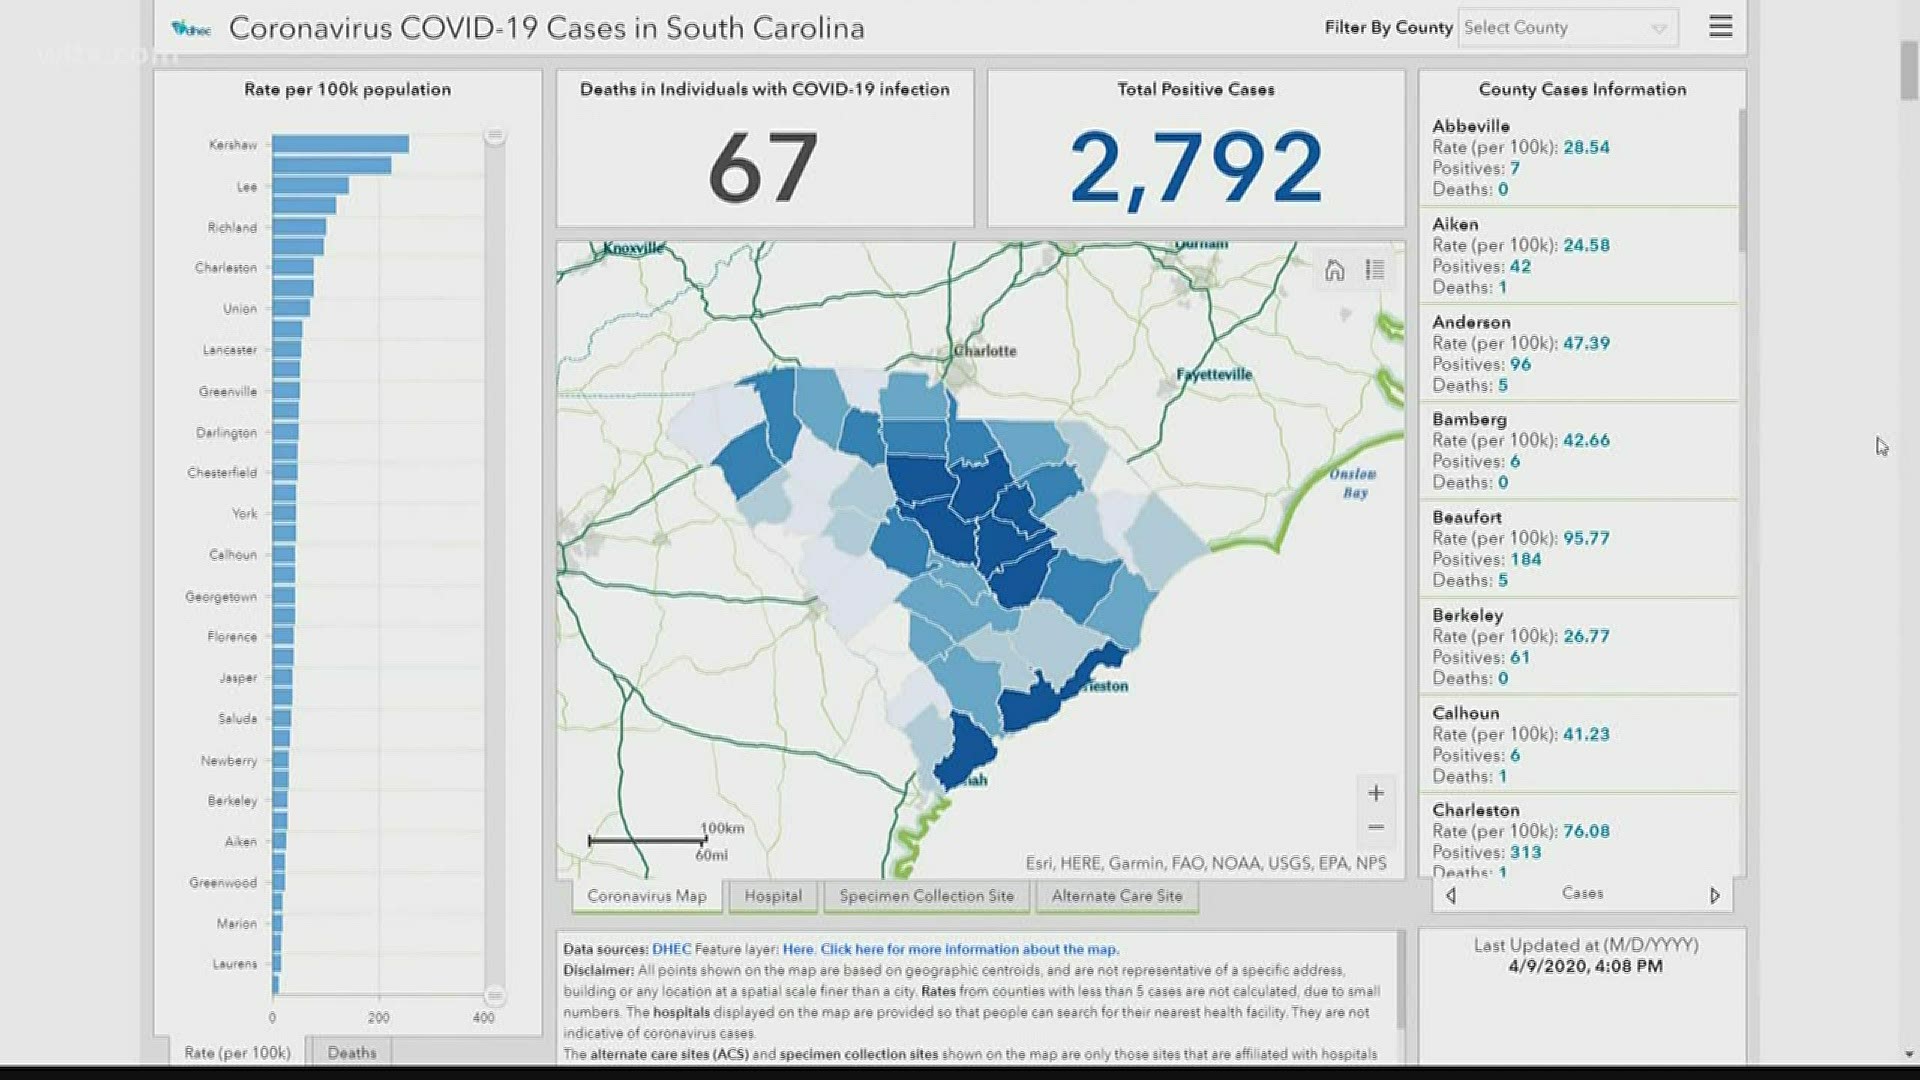
COLUMBIA, S.C. — We're getting a closer look at a new map feature from the South Carolina Department of Health and Environmental Control (DHEC) that shows positive cases per capita in each county.
For the first time, DHEC has a "per capita" feature on their map.
It looks at the number of positive coronavirus cases for every 100,000 residents.
By this standard, the following are the five counties with the highest per capita cases of COVID-19 in South Carolina - all of which are in the Midlands.
- Kershaw County: 170 positive cases, 3 deaths and a rate of 255 people per 100k
- Clarendon County: 75 cases, 3 deaths and a rate of 222 people per 100k
- Lee County: 24 positive cases, 3 deaths and a rate of 142 people per 100k
- Sumter County: 126 positive cases, 3 deaths and a rate of 118 people per 100k
- Richland County: 417 positive cases, 10 deaths and a rate of 100 people per 100k
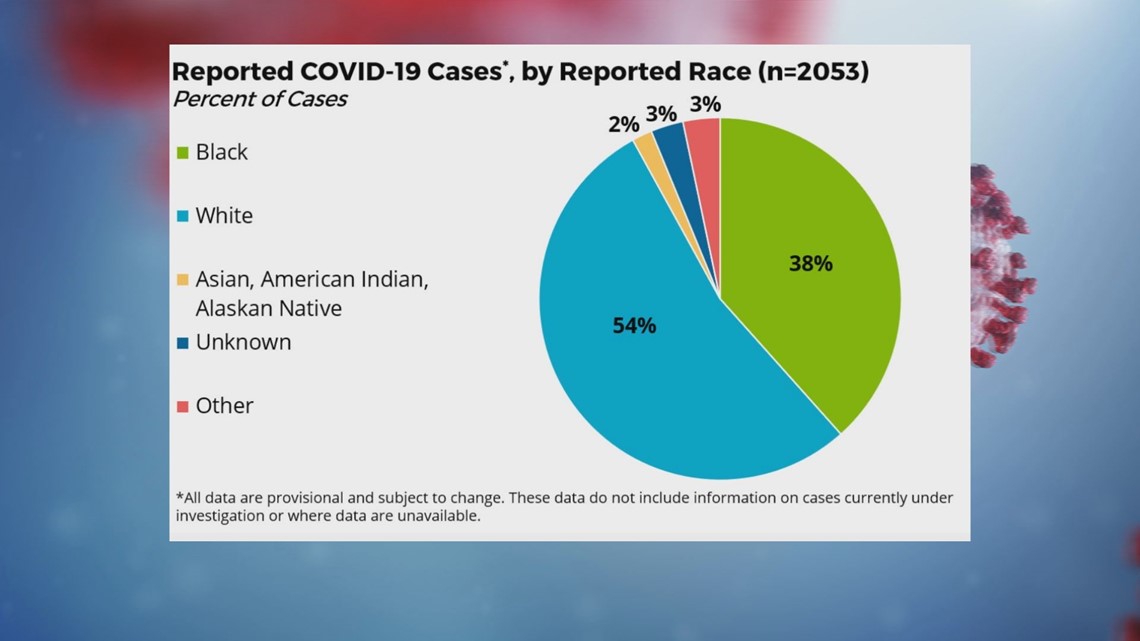
According to statistics provided by DHEC, most COVID-19 the majority of coronavirus cases are among white South Carolinians.

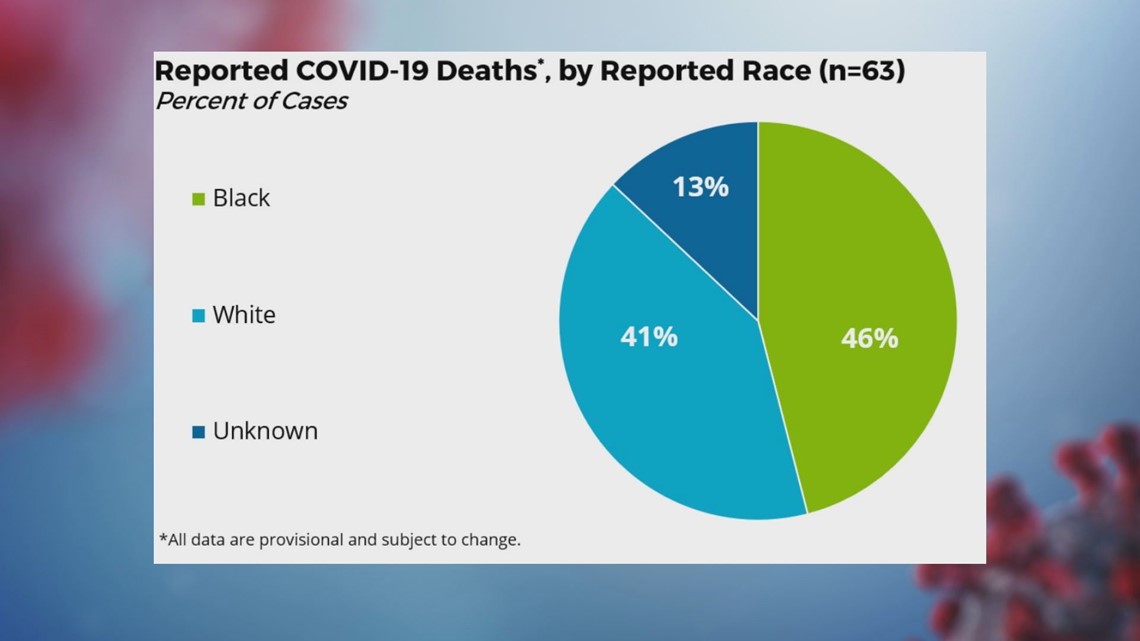
However, the number of deaths is more common among African Americans.

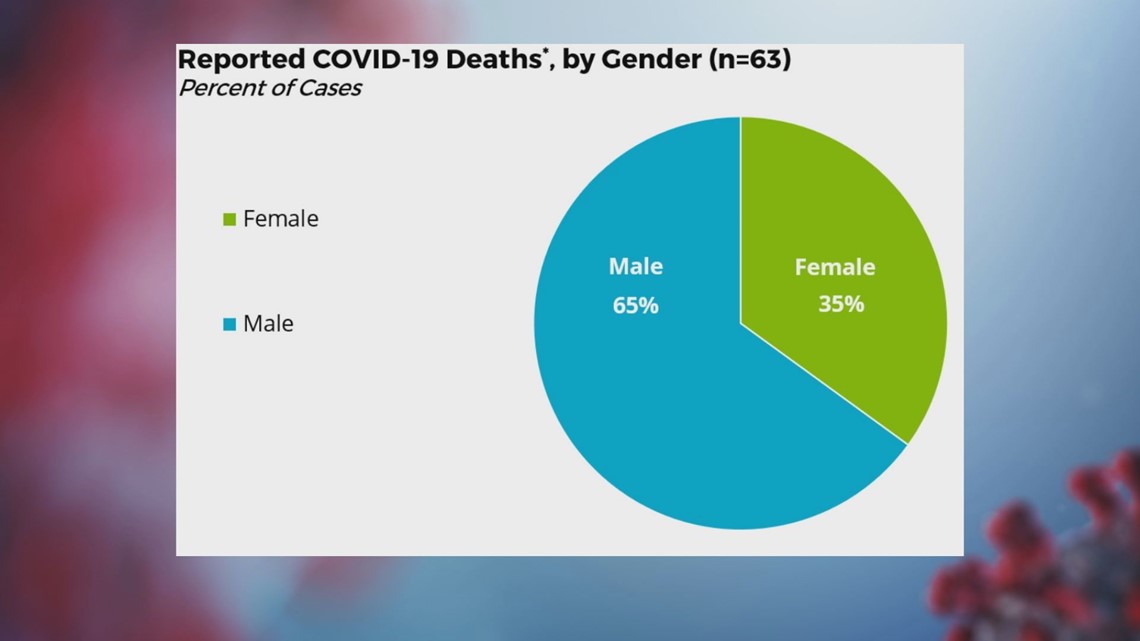
Women are also contracting the virus more than men.

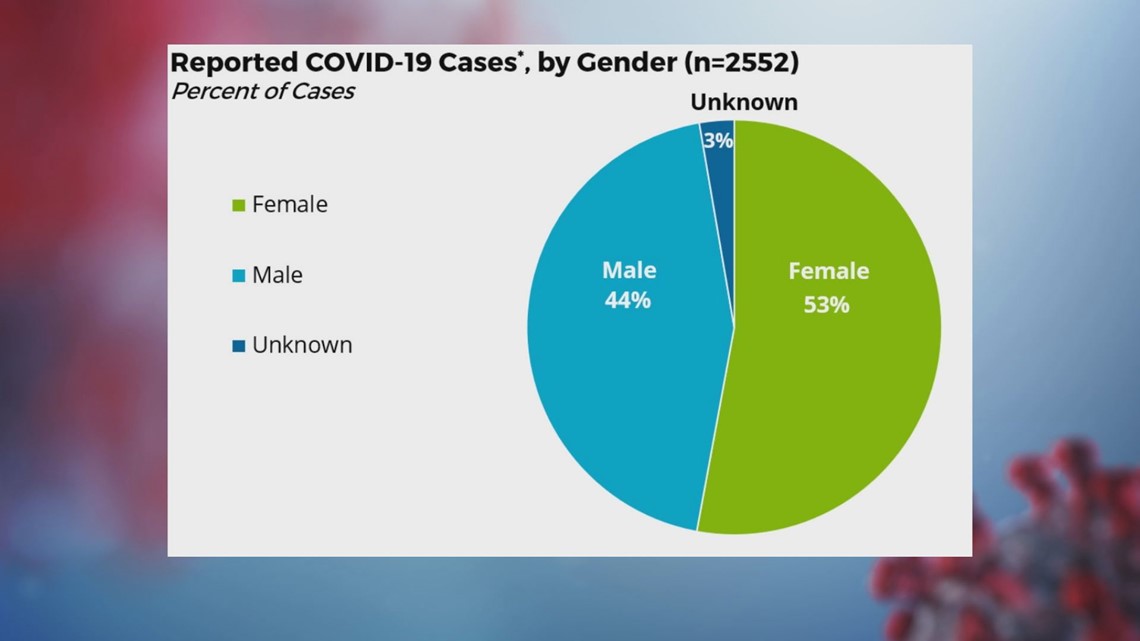
However, the death rate is higher among men.

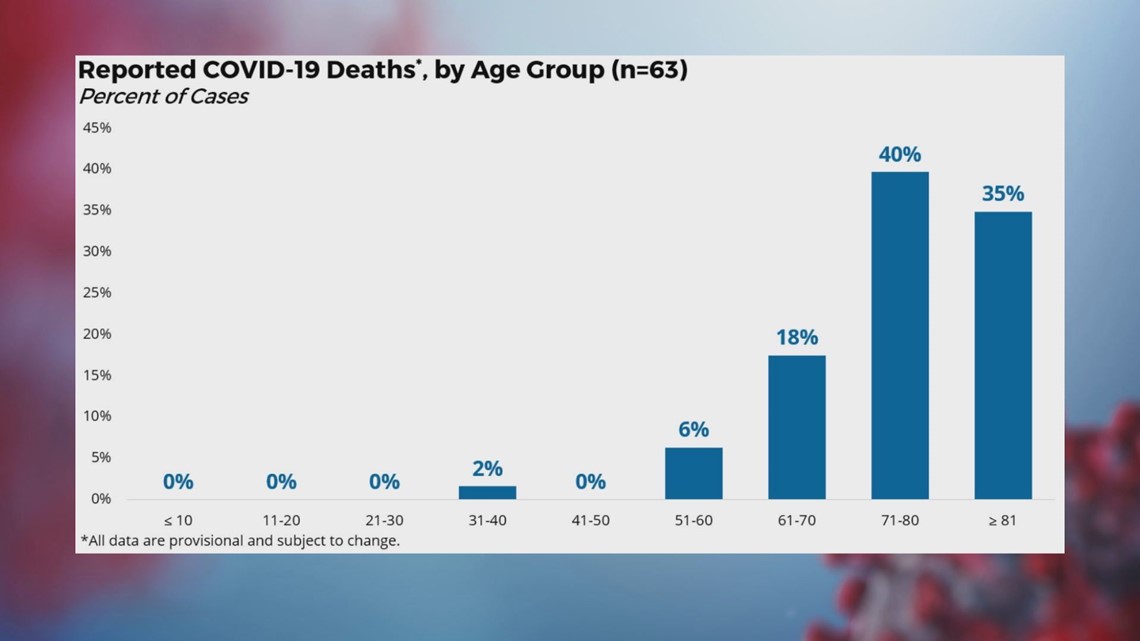
75% of all deaths are residents 71 years and older.

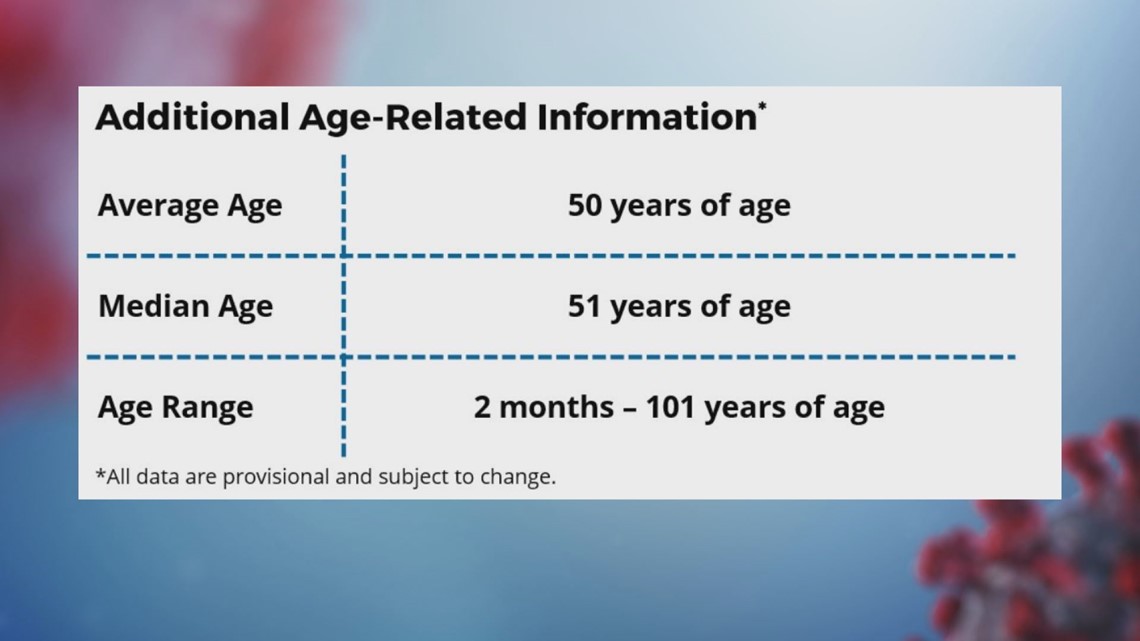
The age of reported COVID-19 cases in the state ranges from 2 months to 101 years old.

Of the more than 26,000 coronavirus tests performed in South Carolina, 89% came back negative.
Curious about coronavirus cases by zip code in South Carolina? Check those numbers here.